Last Reviewed: 01 Jan 2023
Electronic growth charts will plot the weight and height and calculate BMI automatically using the gender and age in the electronic medical record. If your service does not use electronic growth charts, paper growth charts can be accessed through the links below.
Boys 2-18 yrs weight and height
https://www.cdc.gov/growthcharts/data/set1clinical/cj41c021.pdf
Boys 2-18 yrs BMI
https://www.cdc.gov/growthcharts/data/set1clinical/cj41c023.pdf
Girls 2-18 yrs weight and height
https://www.cdc.gov/growthcharts/data/set1clinical/cj41c022.pdf
Girls 2-18 yrs BMI
https://www.cdc.gov/growthcharts/data/set1clinical/cj41c024.pdf
To accurately use paper growth charts, you will need to know the age of the young person in years and months. Use the bottom or top of the chart to find their age, heavy lines for years and lighter line for 6 months. Follow the age line to their current weight (scale is on the right and left) and mark a dot to chart their current weight for age.
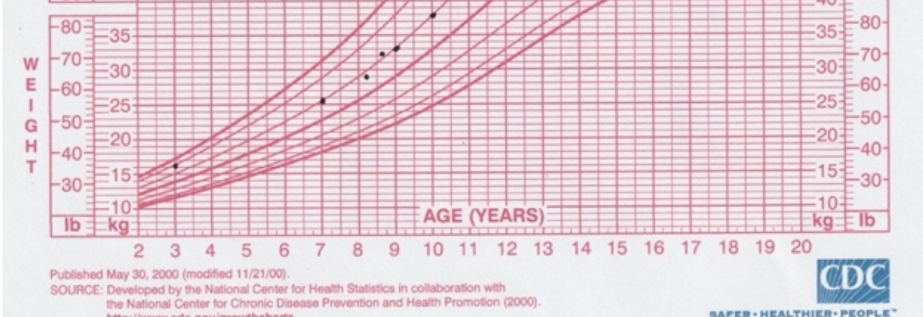
Height and weight charts show a range within a population according to age and sex. 50th percentile (middle curve) is average for the population for age and sex. Some young people are taller, and their height is on the 95th percentile and so weight is expected to also be on the 95th percentile. While others may be shorter with height on the 25th percentile and then weight is expected to also be on the 25th percentile.
For children and young people weight also needs to be considered over time. One weight measure does not give a complete picture. Consider if their weight gain is slowing down (down crossing centiles) or are they gaining weight faster than expected for growth (up crossing centiles).
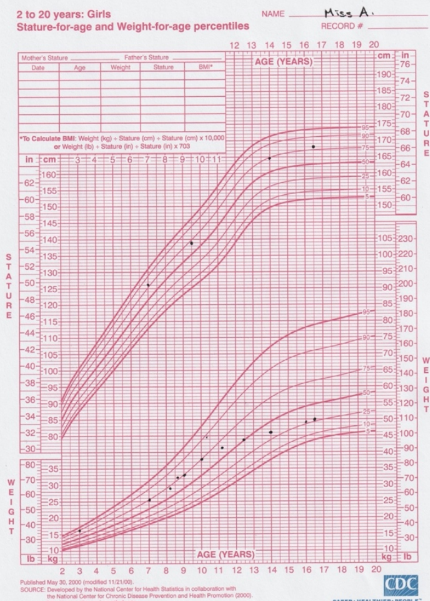
In this chart for a 16 years and 6 month old adolescent girl (Miss A), the last data point is a weight of 50kg. This sits just above the 25th percentile and looks appropriate on its own. However, her height is 168cm and sits just above the 75th percentile so the weight is far below expected for height.
Look at the trend in weight and it is clear that her weight used to follow the 75th percentile and then from about 11 years of age her weight, although increasing, has not been increasing at the same rate as the curves. Her weight has been down crossing centiles from the 75th to the 25th percentile.
Z Scores are an indication of how far away the value is from the 50th percentile. The 50th percentile has a z score of zero. A positive z score is a value above the 50th percentile and a negative z score is a value below the 50th percentile.
Z scores are most useful when the values are off the charts – either above or below – and provide a more accurate way of tracking progress. A weight <3rd percentile may be improving, however, this is difficult to describe numerically. However, a z score that improves from -2.5 to -1.8 shows a great improvement towards the centile curves.
Z scores can be difficult to calculate when using paper files. There are a number of online calculators you can use.
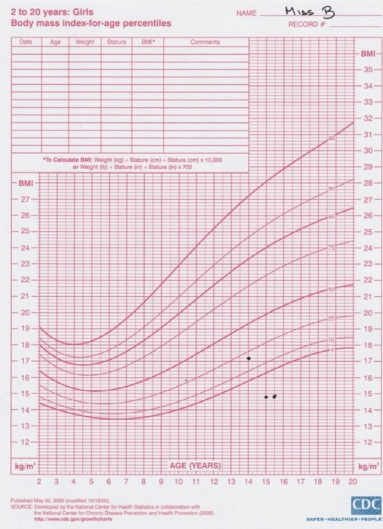
The BMI charts are a calculation of weight and height. Here the aim is for a BMI on the 50th percentile, indicating that the weight is appropriate for height.
To calculate BMI = weight in kg/(Height in m)2
If a 15yo’s weight is 30kg and height 140cm, this can be calculated by weight (kg) divided by height (m) divided by height (m). 30÷1.4÷1.4=15.3 BMI is 15.3kg/m2
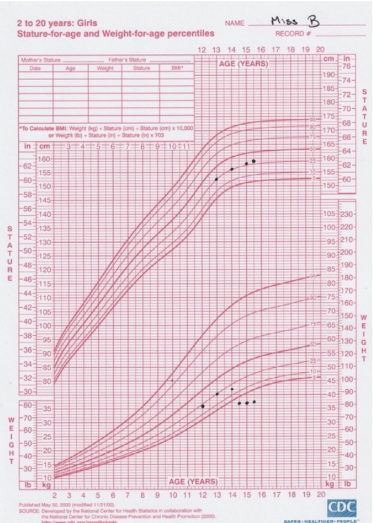
The BMI is then plotted on the BMI centile charts. Miss B’s height is tracking on the 25th percentile, however, between 14 and 14 and a half years of age her weight dropped from around the 25th percentile to <5th percentile and so did her BMI.
Using z scores is an accurate way to describe values that are not on the BMI curves and gives an indication of degree of malnutrition
Mild: BMI Z score of -1 to -1.9
Moderate: BMI Z score of -2 to -2.9
Severe: BMI Z score of -3 or greater
Median BMI (mBMI) is the BMI on the 50th percentile. mBMI is also sometimes used interchangeably with Expected Body Weight (EBW). 100%mBMI or BMI on the 50th percentile is sometimes referred to as the 'expected' or 'healthy' weight goal in community treatment.
Calculation of percent median BMI (%mBMI) of current weight. Using BMI charts, identify the BMI value at the 50% percentile for age. This is the median BMI (mBMI) for age & gender. Calculate the percent median BMI (%mBMI) using their current BMI:
%mBMI = (Actual BMI/Median BMI for age & gender) x 100
On this page:
© 2026 InsideOut
InsideOut acknowledges the tradition of custodianship and law of the Country on which the University of Sydney and Charles Perkins Centre campus stands. We pay our respects to those who have cared and continue to care for Country. We are committed to diversifying research and eliminating inequities and discrimination in healthcare. We welcome all people regardless of age, gender, race, size, sexuality, language, socioeconomic status, location or ability.